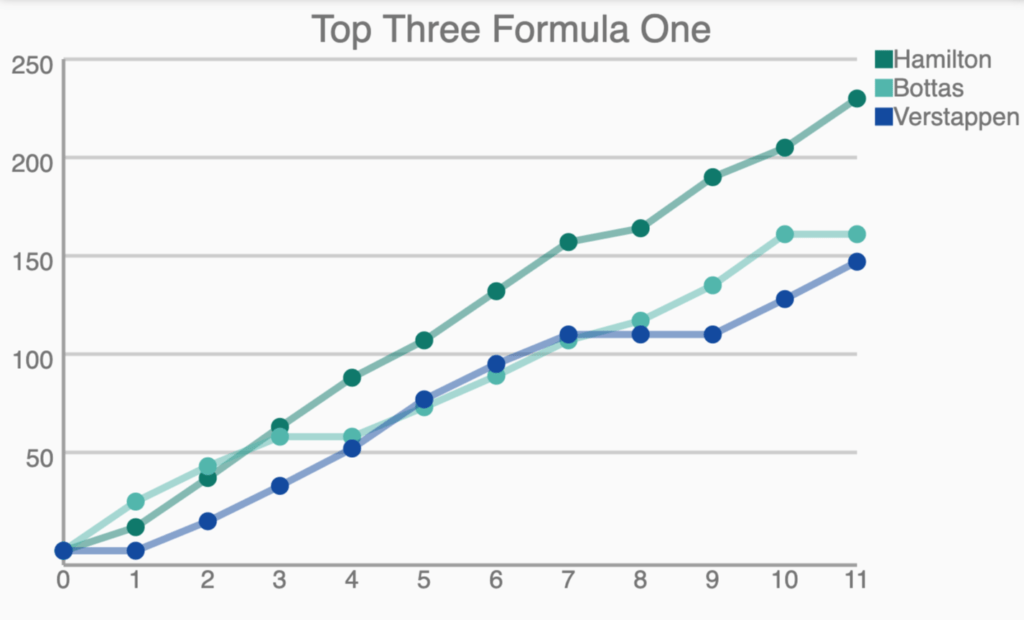
We are going to show how to draw and animate a line chart in Flutter. There are two different animations we would like to show, but first, we are going to show how to draw the static line chart. We are going to use the formula one standing after each race for the top three. First, we will draw the outline of the chart. Afterward, we will add the points and the lines, and finally, we will animate the chart!
Drawing the axes
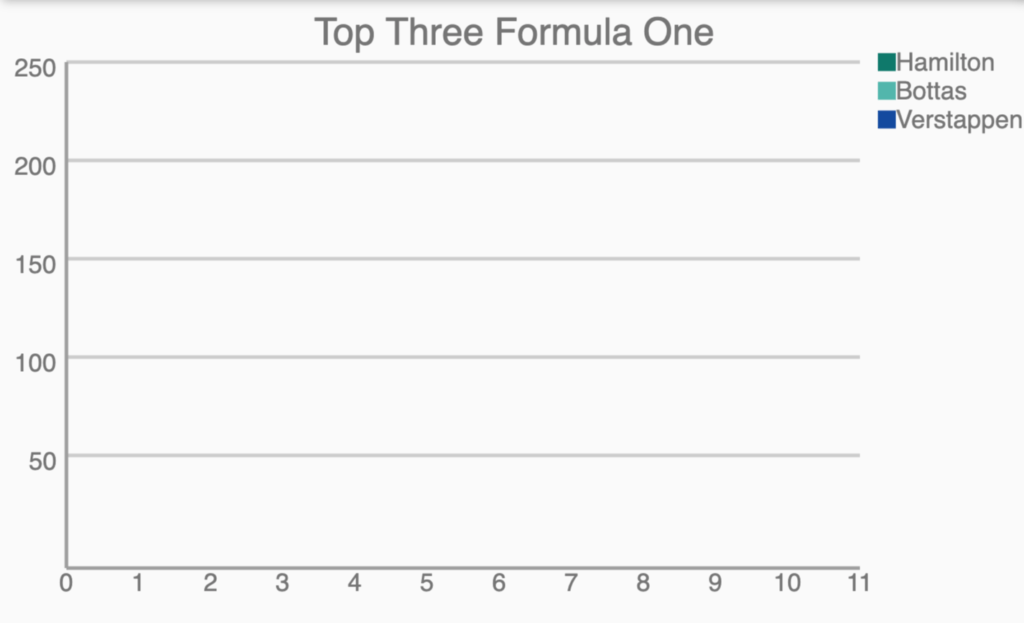
Let’s start by drawing the outline of the chart. We are going to draw the axes, some lines through the chart and … on the axes. First, we are going to draw the two horizontal and vertical axis. To do this we are going to use a CustomPainter. The CustomPainter has a paint method, where we draw everything we want. We are going to compute the margins around the chart before we start drawing. On the top, we need some space for the title. On the right side for the legend. And on the bottom and left side we need some space for the axis.
  LineChartPainter(this.percentage, this.lineData, this.title) {
    // margin left side is based on largest value on the axis
    marginLeft = createText(maxValue.toString(), 1).width + emptySpace;
    // determine where to begin with , based on height of the title
    marginTop = createText(title, titleTextScale).height + emptySpace;
    // determine marginBottom on default text
    marginBottom = createText("1", axisTextScale).height * 2 + emptySpace;
    // determine marginRight based on the largest category name
    marginRight = 0;
    lineData.forEach((element) {
      var width = createText(element.category, legendTextScale).width +
          legendSquareWidth +
          emptySpace;
      if (width > marginRight) {
        marginRight = width;
      }
    });

    // set the categories, based on the entries of the first data
    categories = lineData[0].data.keys.toList();
  }
We can now divide the paint method in some areas which we are going to draw:
  @override
  void paint(Canvas canvas, Size size) {
    drawTitle(canvas, size);
    drawAxes(canvas, size);
    drawLegend(canvas, size);
    drawLines(size, canvas);
  }
Let’s start with something easy, the title. We are going to create a TextPainter based on the title provided in the constructor and a default scaling for the title. Then we can use the TextPainter to draw on the canvas.
  void drawTitle(Canvas canvas, Size size) {
    TextPainter tp = createText(title, titleTextScale);
    tp.paint(canvas, new Offset(size.width / 2 - tp.width / 2, 0));
  }

  TextPainter createText(String key, double scale) {
    TextSpan span =
        new TextSpan(style: new TextStyle(color: Colors.grey[600]), text: key);
    TextPainter tp = new TextPainter(
        text: span,
        textAlign: TextAlign.start,
        textScaleFactor: scale,
        textDirection: TextDirection.ltr);
    tp.layout();
    return tp;
  }
For the axes we need to draw some lines and add the right text on the axes:
  void drawAxes(Canvas canvas, Size size) {
    // draw the horizontal line
    canvas.drawLine(
      Offset(marginLeft, size.height - marginTop),
      Offset(size.width - marginRight, size.height - marginTop),
      axis,
    );
    // draw the vertical line
    canvas.drawLine(
      Offset(marginLeft, size.height - marginTop),
      Offset(marginLeft, marginTop),
      axis,
    );
    // draw the categories on the horizontal axis
    addCategoriesAsTextToHorizontalAxis(size, canvas);
    // draw five sizes on the vertical axis and draw lighter vertical lines
    addHorizontalLinesAndSizes(size, canvas);
  }
Adding a legend
Before we start with the animation we are going to add a legend, so that we know what each line means. To do this we are going to use another method supplied by the canvas, the drawSquare method. We can supply the fill color and the stroke color. We have already shown how to draw text. Combining those two, it should be easy to draw a legend.
  void drawLegend(Canvas canvas, Size size) {
    double i = 0;
    lineData.forEach((element) {
      TextPainter tp = createText(element.category, legendTextScale);
      tp.paint(
          canvas,
          new Offset(
              size.width - marginRight + legendSquareWidth + 2 * emptySpace,
              (i * tp.height + marginTop - tp.height / 2)));
      var center = new Offset(
          size.width - marginRight + legendSquareWidth + emptySpace,
          (i * tp.height + marginTop));
      canvas.drawRect(
          Rect.fromCenter(
              center: center,
              width: legendSquareWidth,
              height: legendSquareWidth),
          getLineDataColorPaint(element));
      i++;
    });
  }
We omitted some code that we thought to be trivial. If you want to see the code so far, you can view it on this Dartpad:
Drawing the points
To draw the points we can use a simple method on the canvas that is supplied to us by the paint method. We can call the drawCircle to draw a point somewhere on the chart. For this, we have to do a conversion of the point to a coordinate on the chart. For the x coordinate we have to look at the category:
    double x = chartWidth(size) *
            categories.indexOf(entry.key) /
            (categories.length - 1) +
        marginLeft;
For the y coordinate we have to look at the max value we have supplied. Then we take into account the margin at the top and at the bottom to compute the height on the chart:
    double y = chartHeight(size) -
        chartHeight(size) * (entry.value / maxValue) +
        marginTop;
Since we can now compute the points, we can use the drawCircle discussed earlier. We will loop over the data for each line and draw all points in the following way:
  void drawLines(Size size, Canvas canvas) {
    lineData.forEach((element) {
      var points = element.data.entries.toList();
      for (int i = 0; i < (points.length); i++) {
          canvas.drawCircle(entryToPoint(points[i], size), 5, getLineDataColorPaint(element));
      }
    });
  }
Drawing the lines
To draw the lines we can reuse the method to compute the coordinates of the points. We already have shown how to draw a line, so now we can loop over the data for each line. Compute the start and endpoint of the line by applying the same conversion. All that we have to do is call the drawLine method with those two points:
  void drawLines(Size size, Canvas canvas) {
    lineData.forEach((element) {
      var points = element.data.entries.toList();
      for (int i = 0; i < (points.length - 1); i++) {
          var firstPoint = entryToPoint(points[i], size);
          var nextPoint = entryToPoint(points[i + 1], size);
          canvas.drawLine(
              entryToPoint(points[i], size), nextPoint, getLinePaint(element));
          canvas.drawCircle(firstPoint, 5, getLineDataColorPaint(element));
      }
        canvas.drawCircle(entryToPoint(points[points.length - 1], size), 5,
            getLineDataColorPaint(element));
    });
  }
So we finally have a line chart: Dartpad
Animating all the lines at the same time
So now we finally have a decent line chart, we can start with the animation. Let’s start with the stuff with always have to do when animating with a CustomPainter. We are going to supply a percentage to the CustomPainter. We have the shouldRepaint method in the ChartPainter, this returns false now. We are going to change it to:
  @override
  bool shouldRepaint(LineChartPainter oldDelegate) => oldDelegate.percentage != percentage;
Now we have to supply the percentage to the ChartPainter. For this, we are going to add an AnimationController and Animation to the ….. We are going to add a TweenAnimation. It is an animation that goes from one number to another. For us, that would be from zero to a hundred so that we can use it as a percentage.
  @override
  Widget build(BuildContext context) {
    return TweenAnimationBuilder(
        tween: Tween<double>(begin: 0, end: 100),
        duration: Duration(seconds: 8),
        builder: (BuildContext context, double percentage, Widget child) {
          return CustomPaint(
            painter:
                LineChartPainter(percentage, data, "Top Three Formula One"),
            child: Container(width: double.infinity, height: 340),
          );
        });
Since we now have a percentage in our Painter, we can use it to determine which lines we have to draw and what parts. For which part of the line should be drawn, we are going to compute a percentage for that line. We can do that with the following formula:
var percentageOfLine = (points.length - 1) * min(percentageCorrected - i * 100 / (points.length - 1), 100 / (points.length - 1));Now we can use this percentage to determine the last point of the line:
          var nextPoint = new Offset(
              percentageOfLine / 100 * (goalPoint.dx - firstPoint.dx) +
                  firstPoint.dx,
              percentageOfLine / 100 * (goalPoint.dy - firstPoint.dy) +
                  firstPoint.dy);
          canvas.drawLine(
              entryToPoint(points[i], size), nextPoint, getLinePaint(element));
If you want to see the code so far, check this Dartpad. Here is a visualisation of the animation:

Animating the lines and points one line at a time
If we want to animate the lines one by one, we have to repeat the same trick as we did for drawing parts of the lines. Instead of computing a new percentage per single line, we are now going to compute a percentage for each complete line. When we have 3 groups and the percentage is 40, we want to see all the lines of group one, the beginning of group two, and none of the lines of group three.
var percentageForGroup = lineData.length * min(percentage - index * 100 / (lineData.length), 100 / (lineData.length));Instead of computing the percentagePerLine with the original percentage we can instead use the new percentage for each group:
var percentageOfLine = (points.length - 1) * min(percentageForGroup - i * 100 / (points.length - 1), 100 / (points.length - 1));That is it! If you want to access the code, you can find it on a Dartpad here, or in Github here. Thanks for reading, if you have any questions, feel free to contact me. One final display of the end result: